In 2020, solid fossil fuels (coal) continued the downward trend of previous years and clocked another 18.3% fall, decreasing for the fifth consecutive year. Compared with 2015, it has dropped by 40%. Their share in the supply mix is now barely above 10%, while in 1990, it was 25.7%.

Although oil (34.5%) and natural gas (23.7%) were still the most important fuel sources in the EU energy mix in 2020, renewable energy’s share continued to rise. After surpassing coal and nuclear, renewables are on the way to becoming the most important energy source in a future EU climate-neutral economy.
Ensuring a fair transition towards climate neutrality (Disponible en español) |
Oil and petroleum products (excluding blended biofuel portion) also declined by 12.6% in 2020, reaching the lowest levels since 1990. Natural gas saw the same tendency, but on a minor scale, decreasing by 2.4%. Nuclear fell by 10.7% and also reached the lowest levels since 1990.
Renewable energies and biofuels continue their long-term upward trend. After surpassing solid fossil fuels and nuclear in the previous decade, the next milestone towards a more sustainable and carbon-free economy would be to exceed natural gas.
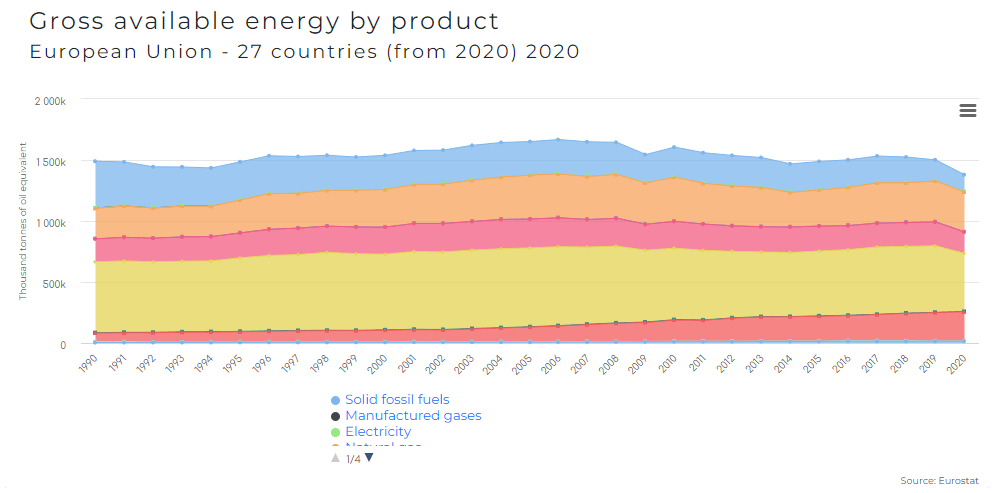
In the graph above the color code is at follows: solid fossil fuels (light blue), natural gas (orange), nuclear heat (light red), oil and petroleum products (light green), renewables and biofuels (red).

Simpler EU energy labels for lighting products |
COVID-19 impact most noticeable in petroleum product
In terms of consumption, the impact of COVID-19-related restrictions in 2020 was more substantial on the use of petroleum products (-10.3%) than on natural gas (-2.6%) and electricity (-3.8%).
Movement restrictions related to the pandemic affected some petroleum products more than other fuels. Kerosene-type jet fuel registered a notable drop (-48.1%), while motor gasoline (-13.9%) saw a smaller decrease.
Oil continues to be the most important fuel on the end-use side with a 35.0% share, followed by electricity with 23.2% and natural gas with 21.9%.
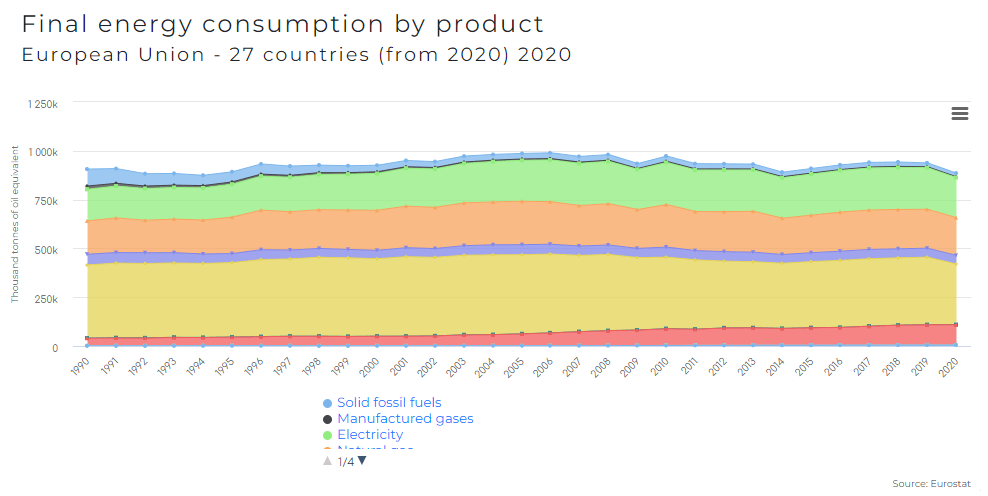
In the graph above the color code is at follows: solid fossil fuels (light blue), natural gas (orange), nuclear heat (light red), oil and petroleum products (light green), renewables and biofuels (red).

Evolution of electriciy prices |


Leave a Reply