The price of electricity continues to rise in Europe. The cause of this phenomenon stems from several supply and demand factors, one of the most important of which is the shortage of natural gas and the sudden reactivation of demand, linked to a reduced supply of CO2 emission allowances.
Commission President Ursula von der Leyen addressed the plenary session of the European Parliament dedicated to the preparation of the European Council meeting focusing on the recent increase in energy prices. Recalling that we import 90% of the gas we consume, the President stressed: “Europe is too dependent on gas and therefore our dependence on gas imports is excessive. This makes us vulnerable. Our response has to be based on diversifying our suppliers, but also on maintaining natural gas as a transition fuel and, above all, on accelerating the transition to clean energy. The European Green Pact is, in the medium and long term, a pillar of European energy sovereignty in the 21st century”. The President also outlined the provisions that can be implemented to deal with the situation in the short term, thanks to the package of measures presented last week: “Our priority is to help vulnerable families and businesses. Some measures can be taken very quickly, in line with existing EU rules, for example: relief measures for businesses, especially SMEs, through state aid; targeted support for consumers and reduction of energy taxes and charges. Member States can act very quickly on these issues.” The EU’s recovery program, NextGenerationEU, has already earmarked €36 billion for clean energy, such as hydrogen or offshore wind. Only “real European teamwork” will be able to achieve this goal, the president said. Ahead of the climate summit to be held at the end of the month, she added: “The upcoming COP26 in Glasgow will be the moment for the whole world to move forward more decisively. The world is not yet on track to meet the commitments made under the Paris Agreement. Much remains to be done to prevent global temperatures from rising more than 1.5 degrees above pre-industrial levels. The European Union will go to Glasgow with the highest possible ambition. We have to do it for Europe, for our planet and for future generations”.
The price of energy in the EU depends on a range of different supply and demand conditions, including the geopolitical situation, the national energy mix, import diversification, network costs, environmental protection costs, severe weather conditions, or levels of excise and taxation. Note that the prices presented in this article include taxes, levies and VAT for household consumers, but exclude refundable taxes and levies for non-household consumers.
The following graph shows an evolution of the electricity prices from 2008 to 2020 in the countries of France, Germany, Italy, Netherlands, Portugal and Spain:

In order to go more in depth with this information, the figure below is a breakdown of energy and supply (green), network (yellow), and taxes, fees and charges (orange) in all European countries:

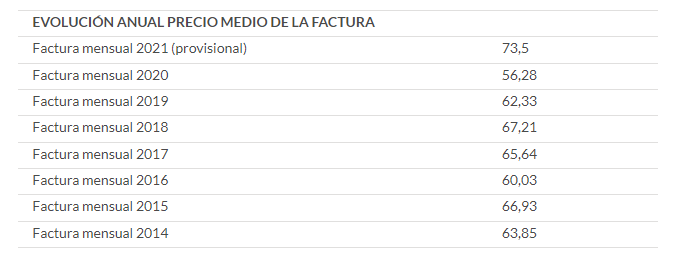
The country with the highest price in electricity in 2020 was Romania (0,28€ per kWh), followed by Germany (0,27€ per kWh) and Czech (0,26€ per kWh). Spain was placed 6th with a price of 0,25€ per kWh. However, this price has been increasing during this last time. According to OCU the annual evolution average invoice price in Spain is presented in the table below:
As it is seen, the most expensive price up to the moment is the monthly invoice of the year 2021.
Electricity prices for household consumers
Highest electricity prices in Germany and Denmark
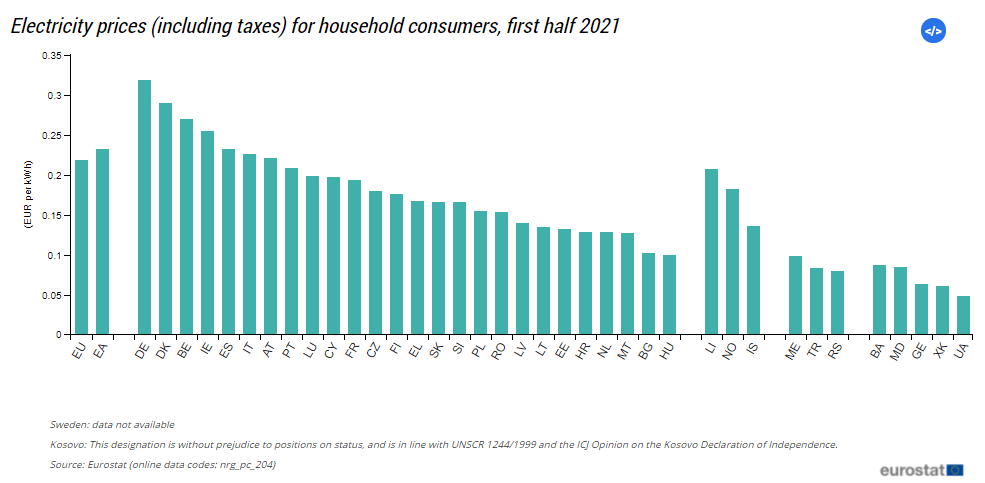
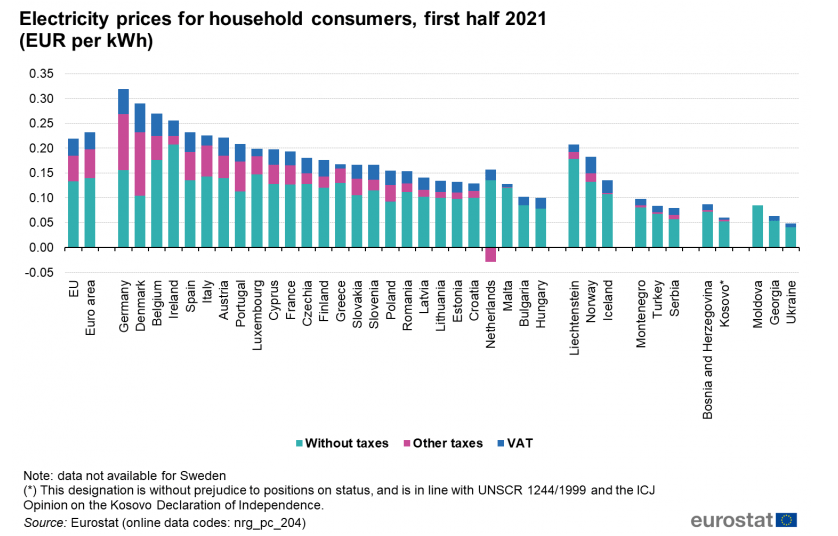
For household consumers in the EU (defined for the purpose of this article as medium-sized consumers with an annual consumption between 2 500 kWh and 5 000 kWh), electricity prices in the first half of 2021 were highest in Germany (EUR 0.3193 per kWh), Denmark (EUR 0.2900 per kWh), Belgium (EUR 0.2702 per kWh) and Ireland (EUR 0.2555 per kWh); see Figure 1. The lowest electricity prices were in Hungary (EUR 0.1003 per kWh), Bulgaria (EUR 0.1024 per kWh) and Malta (EUR 0.1279 per kWh). The price of electricity for household consumers in Germany was more than three times higher than the price in Hungary and 45.6 % higher than the EU average price.
The EU average price in the first semester of 2021 — a weighted average using the most recent (2021) data for electricity by household consumers — was EUR 0.2192 per kWh.
Figure 1
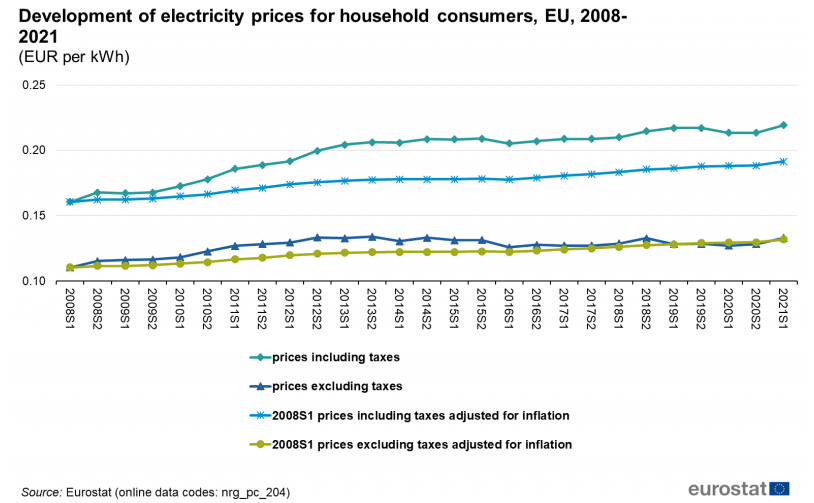
Figure 2 depicts the development of electricity prices for household consumers in the EU since the first half of 2008. The price without taxes, i.e. the energy, supply and network, increased slightly faster than the overall inflation rate (HICP) until the second half of 2013 when it was EUR 0.1338 per kWh. From 2014 to 2019, it remained relatively stable. In the first semester 2021 it stood at EUR 0.1329 per kWh, slightly up from EUR 0.1282 per kWh in the previous semester. The weight of the taxes has increased by 8.8 percentage points over the last 13 years, from 31.2 % in the first half of 2008 to 39.4 % in the first half of 2021.
For the prices adjusted for inflation, the total price for household consumers, i.e. including all taxes, was 0.1914 EUR per kWh in the first half of 2021 compared to 0.1604 EUR per kWh in the first half of 2008. We observe that this price is lower than the actual price including taxes, whereas the actual price excluding taxes is approximately on the same level as the 2008 price adjusted for inflation.
Figure 2
Weight of taxes and levies differs greatly between Member States
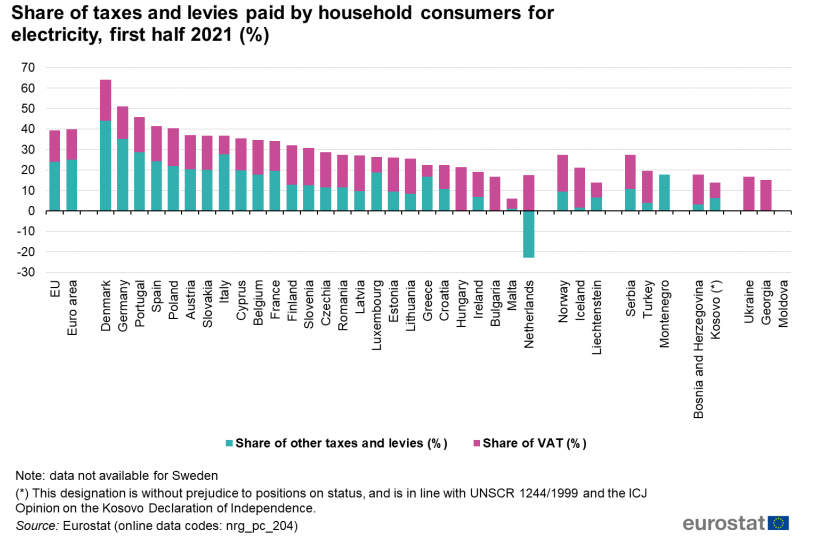
Figure 3 shows the proportion of taxes and levies in the overall electricity retail price for household consumers. In the EU, the share of taxes in the first half of 2021 was smallest in the Netherlands, where the values were in fact negative (-5.5 %). The Netherlands provide a refund (allowance), and thus reported a negative share of other taxes and levies in this collection. The allowance has indeed increased over time. It is not COVID-19 related. The government uses this instrument to move the tax burden from households to non-households. The relative share of taxes was highest in Denmark, making up 64.1 % of the total price. The average share of taxes and levies on the EU level was 39.4 %. The VAT in the EU represents 15.5 % of the total price. It ranges from 4.8 % in Malta to 21.3 % in Hungary.
Figure 3
Largest drops in electricity prices in the Netherlands, Cyprus and Lithuania
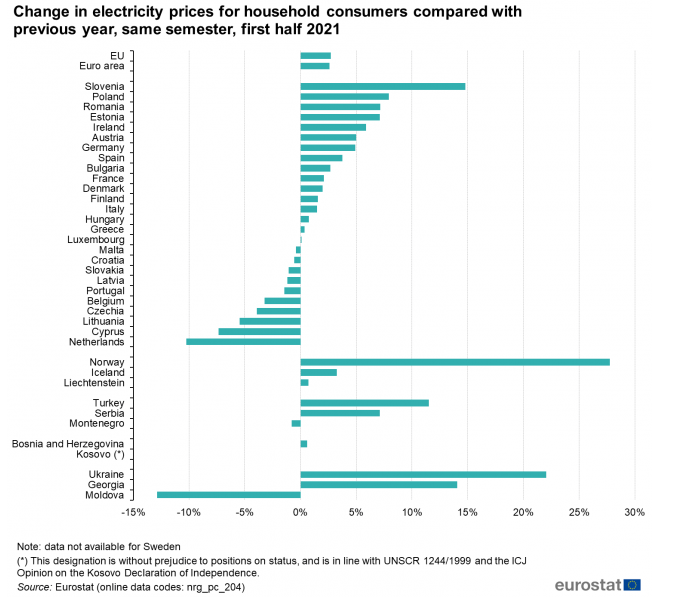
Figure 4 shows the percentage change in electricity prices for household consumers including all taxes and VAT in the first half of 2020 to the first half of 2021. For comparison purposes the national currencies were used. For energy prices, comparing year on year, instead of semester on semester, is most meaningful to avoid seasonal effects. Year on year, the total prices fell in ten EU Member States. The biggest decrease is observed in the Netherlands (-10.2 %), followed by Cyprus (-7.4 %). Tax decreases mainly drove the reduction in the Netherlands, where the refund (allowance) increased. All components contributed to the decrease in Cyprus. Slovenia (14.8 %) and Poland (7.9 %) recorded the highest relative price increase. All components contributed to these increases.
Figure 4
Electricity prices in purchasing power parity
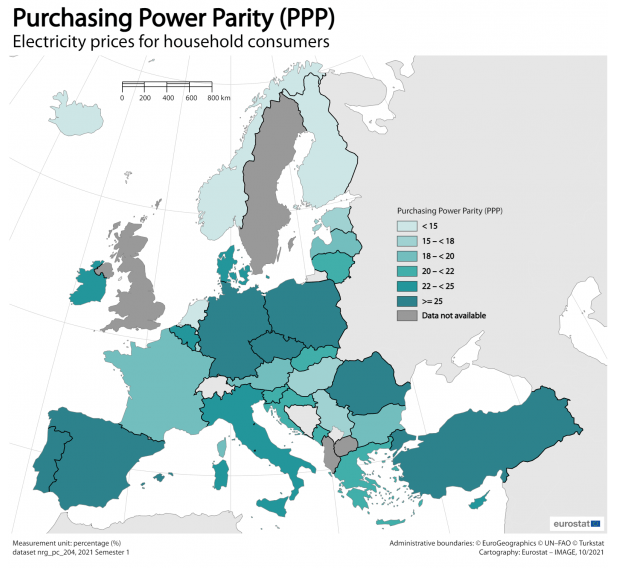
In figure 5, prices are shown in purchasing power parities (PPP) and grouping countries in five categories, with PPP electricity prices ranging from above 25 to below 15. These data correspond to the price per 100 kWh. The final burden for the consumer depends on their own consumption. Electricity prices based on purchasing power parities are highest in Romania (29) and Germany (28). The lowest electricity prices based on the Purchase Power Standard are observed in the Netherlands (11) and Finland (14).
Figure 5
Share of transmission & distribution costs for non-household electricity consumers
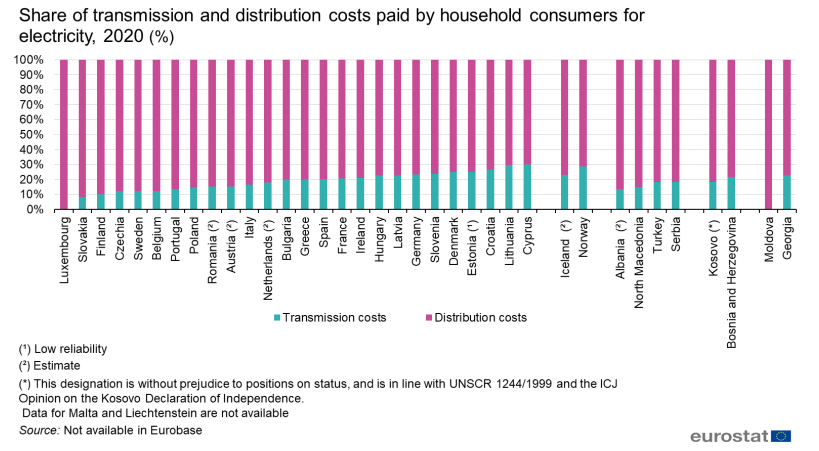
Figure 6 presents the share of transmission & distribution costs for household electricity consumers. Transmission and distribution costs are only reported once a year, at the end of the second semester. Therefore this section refers to 2020 data. Distribution costs account for the largest share by far, when compared to the transmission costs. This is normal for all types of networks including the electricity system.
Transmission network is used for transmitting bulk amounts of energy in long distances. The distribution network is usually the part of the system where the consumers are connected. The distribution network is denser than the transmission network, therefore, its share in the costs is expected to be higher.
Countries with lower population density require more extensive transmission network to meet their needs. Its costs are higher when compared to the countries with higher population density. Smaller, densely populated countries use mostly their distribution network.
In 2020, Luxembourg, Slovakia and Finland have the highest share of distribution costs, with 100%, 91.8% and 90% respectively. In 2020, Cyprus, Lithuania and Croatia have the highest share of transmission costs with 30.0 %, 29.6 % and 26.5 % respectively.
Figure 6
Electricity prices for non-household consumers
Electricity prices highest in Germany and Italy
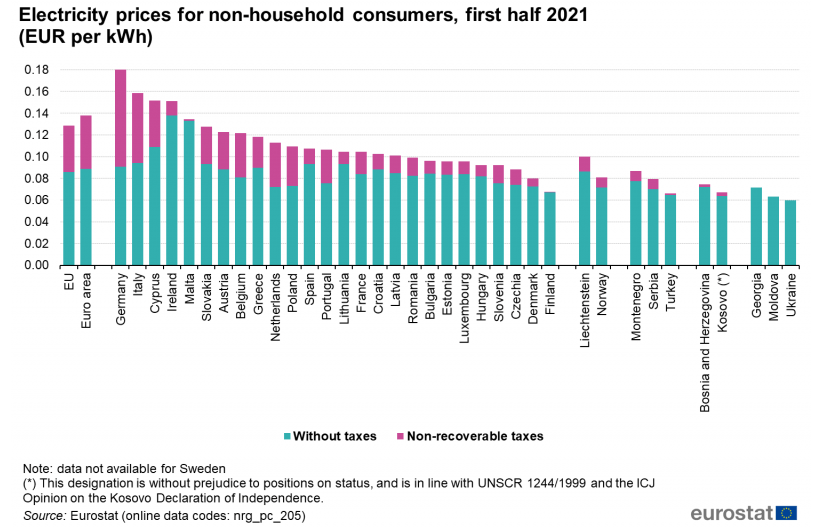
Non-household consumers are defined for the purpose of this article as medium-sized consumers with an annual consumption between 500 MWh and 2 000 MWh. As depicted in Figure 7, electricity prices in the first half of 2021 were highest in Germany (EUR 0.1813 per kWh) and Italy (EUR 0.1584 per kWh). We observe the lowest price in Finland (EUR 0.0676 per kWh) and Denmark (EUR 0.0797 per kWh). The EU average price in the first semester of 2021 was EUR 0.1283 per kWh. The aggregates are weighted averages taking into consideration the average consumption in each band.
Figure 7
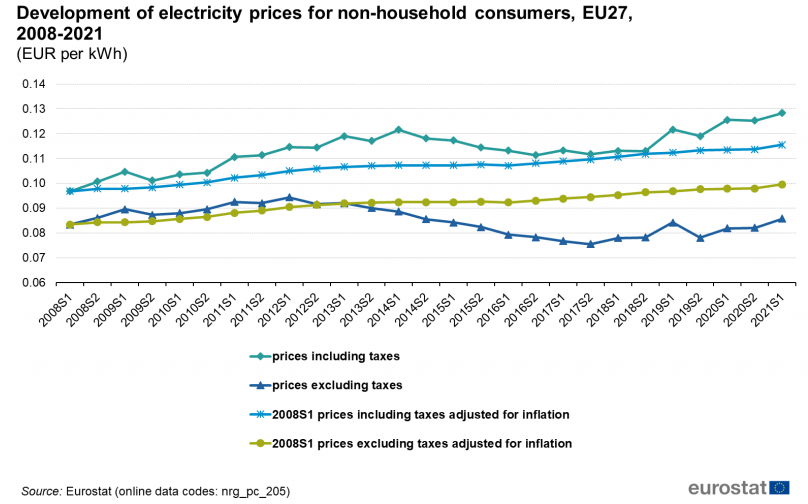
Figure 8 shows the development of electricity prices for non-household consumers in the EU since the first half of 2008. The price without taxes, i.e. the energy, supply and network, was increasing similarly to the overall inflation until 2012, when it peaked at EUR 0.0943 per kWh in the first semester. Afterwards it was on the decrease until 2020. In the second semester of 2019, for example, it was at EUR 0.0781 per kWh, whereas in the second half of 2020 it increased and stood at EUR 0.0822 per kWh, which is still lower than the 2008 first semester price. In the first half of 2021 the increase continued, with the price without taxes now at EUR 0.0857 per kWh.
The weight of the taxes has increased considerably by 19.4 percentage points over the last 13 years, from 13.8 % in the first half of 2008 to 33.2 % in the first half of 2021. Therefore, if we look at the non-household total price, i.e. including the non-recoverable taxes, for the first half of 2021, it increased (32.5 %) compared to the 2008 first half price adjusted for inflation from EUR 0.0968 per kWh to EUR 0.1283 per kWh.
For the prices adjusted for inflation, the total price for non-household consumers, i.e. including taxes, was EUR 0.1155 per kWh in the first half of 2021 compared to 0.0968 EUR per kWh in the first half of 2008. We observe that this price is lower than the actual price including taxes. The total price for non-household consumers, i.e. without taxes, was EUR 0.0995 per kWh in the first half of 2021 compared to 0.0834 EUR per kWh in the first half of 2008. We observe that this price is higher than the actual price excluding taxes.
Figure 8
Proportion of non-recoverable taxes and levies in electricity prices
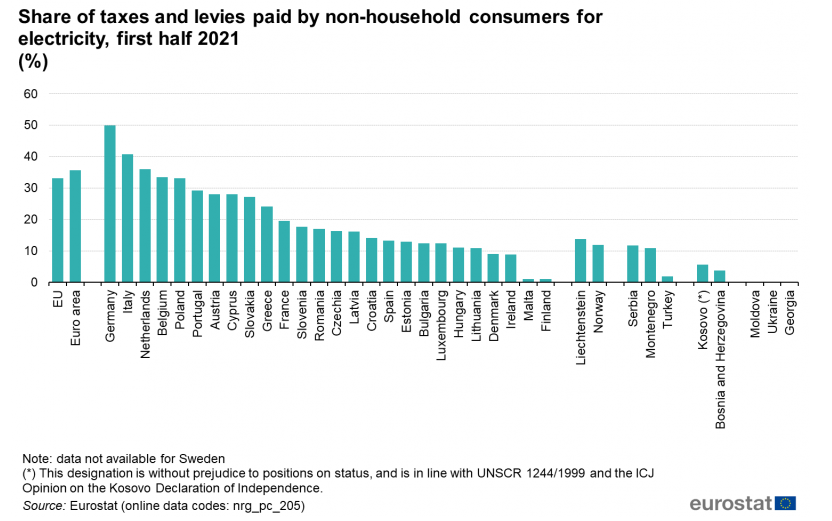
Figure 9 presents the proportion of non-recoverable taxes and levies in the overall electricity price for non-household consumers. In the first half of 2021, the share of taxes was highest in Germany and Italy, where non-recoverable taxes and levies made up 49.9 % and 40.7 % of the total price respectively. The share of taxes for the EU is 33.2 %.
Figure 9
Development of electricity prices for non-household consumers
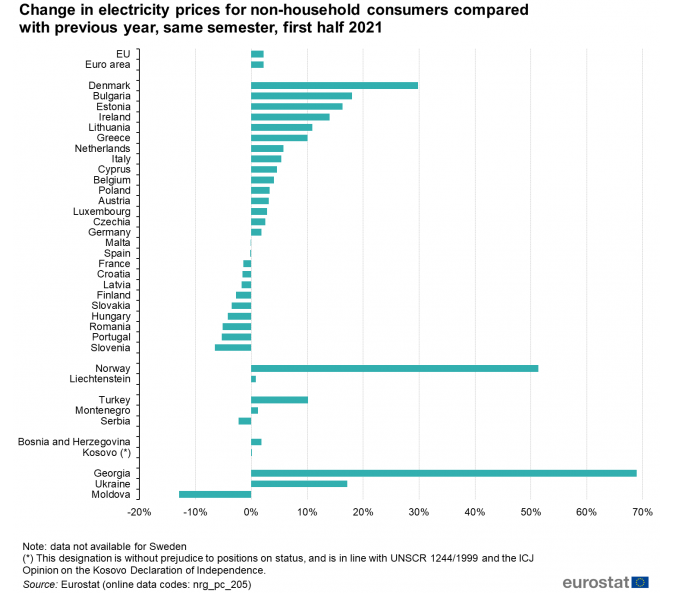
Figure 10 shows the change in electricity prices for non-household consumers including all non-recoverable taxes and levies from the first half of 2020 to the first half of 2021. For comparison purposes the national currencies were used. These prices dropped in eleven EU Member States. The biggest decreases were recorded in Slovenia (-6.5 %) and Portugal (-5.2 %), closely followed by Romania (-5.1 %). It increased in the other sixteen EU Member States. We recorded by far the largest increase in Denmark (29.8 %), with Bulgaria in the second place (18.0 %), followed by Estonia (16.3 %). Other countries with an increase of 10.0 % or more are Ireland (14.0 %), Lithuania (10.9 %) and Greece (10.0 %).
Figure 10
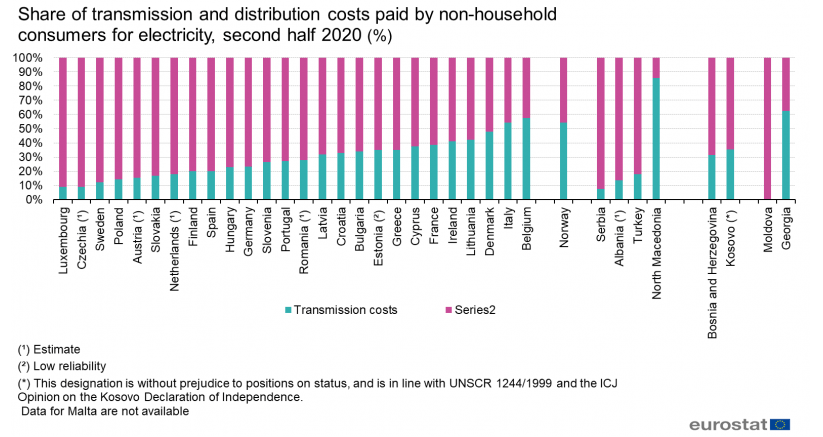
Share of transmission & distribution costs for non-household electricity consumers
Figure 11 presents the share of transmission & distribution costs for non-household electricity consumers. Transmission and distribution costs are only reported once a year, at the end of the second semester. Therefore this section refers to 2020 data. As for households consumers, distribution costs account for the largest share, compared to transmission costs. This is normal for all types of networks including the electricity system. Transmission network is used for transmitting bulk amounts of energy in long distances. The distribution network is usually where the consumers are connected. The distribution network is denser than the transmission network, therefore, its share at the costs are expected to be higher.
Countries with lower population density more extensive transmission network to meet their needs. Its costs are higher, when compared to the countries with higher population density. Smaller, densely populated countries use mostly their distribution network.
However, several non-households consumers can be directly connected to the transmission network or use part of the distribution network (medium voltage only). Therefore, transmission cost share can be higher when compared to households consumers.
In 2020, Luxembourg, Czechia and Sweden have the highest share of distribution costs, with 91%, 90.8% (estimated) and 87.8% respectively. In 2020, Belgium, Italy and Denmark have the highest share of transmission costs with 57.6 %, 54.2 % and 48.0 % respectively.
Figure 11




Leave a Reply