In 2021, the EU’s natural gas import dependency rate was 83%. This is 1 percentage point (pp) less than 2020 (84%). This small decrease in import dependency was significantly influenced by the fact that most EU Member States used stocks of natural gas that were imported in previous years. In fact, the drop in natural gas stocks in 2021 was the largest since the start of the time series (2008).
The EU Member State with the highest dependency on natural gas imports in 2021 was Malta (104%), followed by Sweden (102%) and Lithuania (101%), which have increased their stocks. On the other hand, the lowest dependency on natural gas imports was recorded in Romania (24%), followed by Denmark (26%) and the Netherlands (33%).
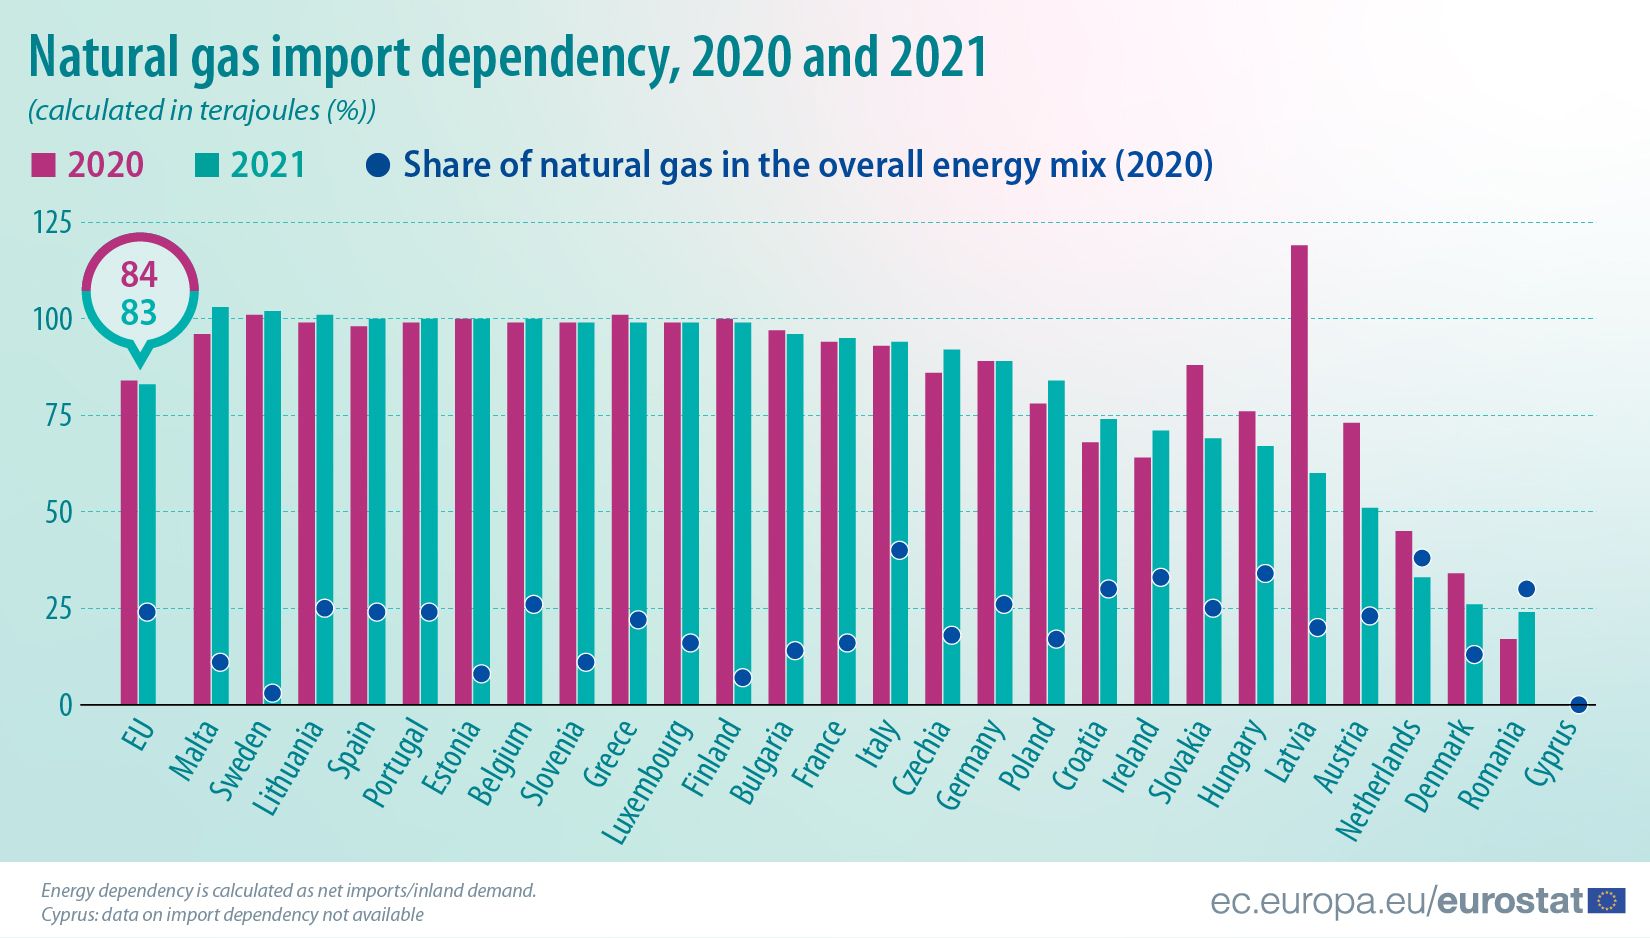
The impact of a potential import disruption needs to take into account the importance of natural gas in the overall energy mix. While the import dependency in Sweden, Finland and Estonia is near 100%, the share of natural gas in the energy mix is relatively low (3%, 7% and 8% respectively). By contrast, the highest share of natural gas in the energy mix is in Italy (40%) and its import dependency is 94%. The Netherlands has the 2nd highest share of natural gas in its energy mix, however its import dependency is much lower, due to its domestic production of natural gas.
When compared with 2020, the largest increases in the dependency rate on natural gas imports were recorded in Malta (from 96% in 2020 to 104% in 2021; +8 pp), Ireland (from 64% to 71%; +7 pp) and Romania (from 17% to 24%; also +7 pp).
At the other end of the scale, the largest decreases were recorded in Latvia (from 121% to 61%; -59 pp), Austria (from 73% to 51%; -22 pp) and Slovakia (from 88% to 69%; -20 pp).
Consumer trends
In 2021, inland demand of natural gas in the EU increased by 4.3 % compared with 2020, to reach 15 834 900 terajoules. EA-19 consumption increased by 4.1 %, to 13 315 096 terajoules. The most significant increases in consumption were recorded in Estonia (13.3 %), Bulgaria (12.6 %) and Slovakia (11.9 %), while the largest drops occured in Lithuania (-5.6 %), Portugal (-4.5 %) and Ireland (-3.9 %). In 2021, Germany, Italy and France had the highest inland demand with 3 633 109 terajoules, 2 899 704 terajoules and 1 718 451 terajoules respectively.
Positive values over 100 % indicate stocks build-up during the reference period.
Supply structure
Natural gas production
EU natural gas production continued its decreasing trend, falling by 7.6 % in 2021 compared with 2020, to 1 755 874 terajoules. For the euro area, a decrease of 9.8 % was recorded, with production amounting to 1 110 745 terajoules. The main EU natural gas producer, the Netherlands, registered a drop in production of 9.4 %. With a natural gas production of 724 748 terajoules in 2021, the Netherlands remained the first producer of natural gas in the EU, followed by Romania, whose primary production equaled to 343 927 terajoules, and Germany, whose primary production was of 169 004 terajoules.
Natural gas imports
Total EU imports of natural gas increased by 0.1 % to reach 24 669 663 terajoules. The most significant increases in 2021 compared with 2020 among the main net importers, i.e. countries importing at least 1 000 000 terajoules, was observed in Spain (13.8 %), Italy (9.8 %) and Czechia (4.9 %) whereas the main decreases were recorded in Slovakia (-20.5 %), Austria (-7.5 %) and Poland (-4.3 %).
It is important to remember a methodological change in reporting monthly natural gas trade since reference month January 2013. The monthly reporting provides import figures as entries from the last transit country (mostly neighbouring countries) instead of the country of origin (i.e. the country of primary/indigenous production) and export figures as exits from the reporting country (thus including all natural gas transiting its national territory). This is different from the methodology for annual data, where the ultimate origin of imports is reported, thus excluding all natural gas transit, also from export figures.
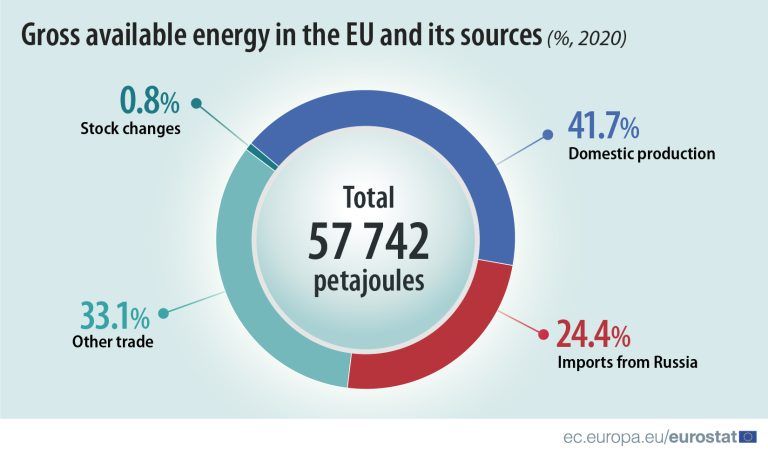
As regards the origin of imports (entries), Russia was the source of 23.3 % of the natural gas entering the EU (intra-EU trade and entries from Switzerland both excluded), followed by Norway (22.7 %), Ukraine (10.2 %) and Belarus (8.9 %) (see Figure 5). However, considering that most gas entering the EU from Ukraine and Belarus originally comes through Russia, the dependency on natural gas imports (as ultimate origin) from Russia is in practice higher than from Norway.
EU will import 58% of its energy by 2020 |


Leave a Reply