Weight of goods handled by EU ports dropped by 7% in 2020. In 2020, EU ports handled around 3.3 billion tonnes of goods in gross weight, a substantial decrease compared with 2019 (-7%). This fall can be attributed to the COVID-19 pandemic and the subsequent restrictions put in place across the Member States and worldwide.
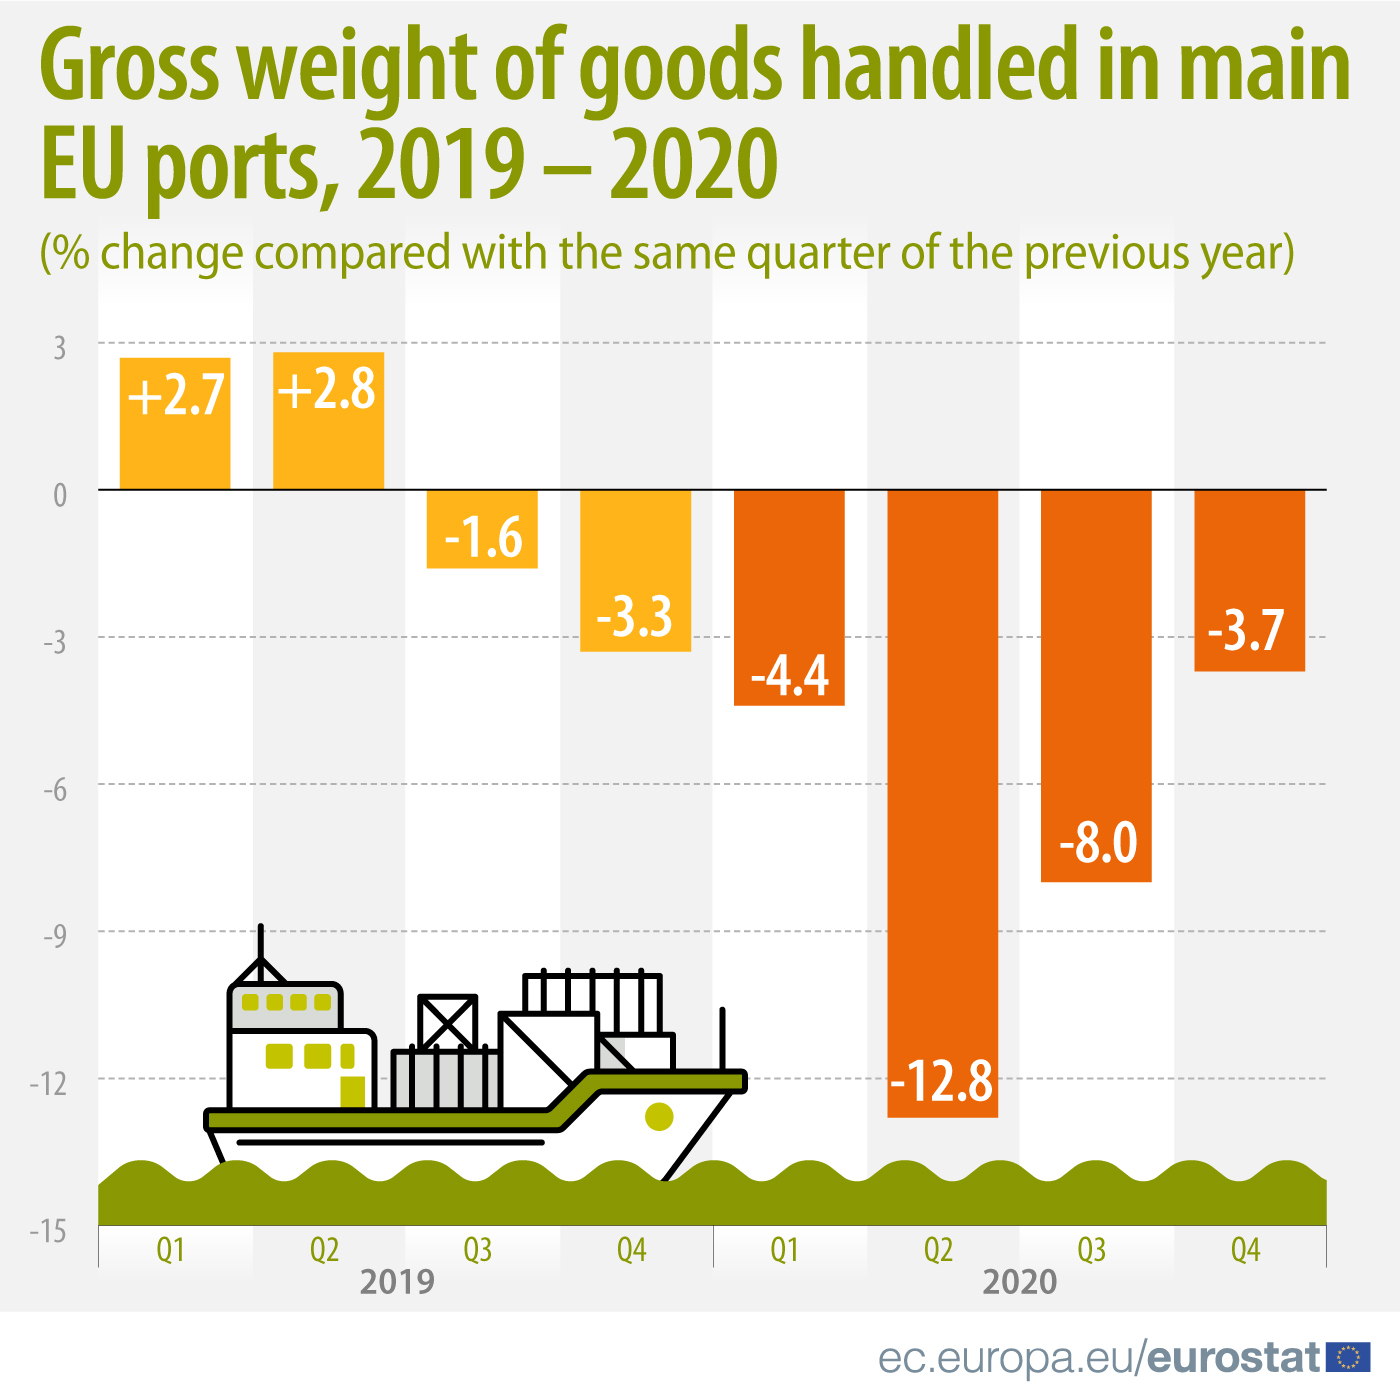
After reaching a new peak in 2019 (3.6 billion tonnes), the gross weight of goods handled in EU main ports in 2020 decreased to levels similar to 2015. The last two quarters of 2019 and all quarters of 2020 showed a negative evolution when compared with the same quarters of the previous year. The second and third quarters of 2020 were particularly hit with decreases of -13% and -8%, respectively.
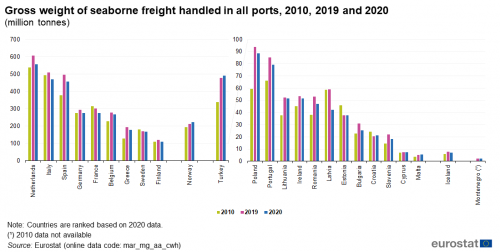
The Netherlands remained the largest maritime freight transport country in the EU in 2020. Dutch ports handled 558 million tonnes of goods, 17% of the total volume of seaborne goods handled last year in the EU. The Netherlands was followed by Italy and Spain, each with a share of 14%.
Rotterdam, Antwerpen, Hamburg, Amsterdam, Algeciras, Marseille, Valencia and Trieste maintained their positions as the eight largest freight ports. However, only Valencia (+0.5%) handled more tonnes of goods compared to 2019. All the other ports saw a decrease in tonnes handled compared with 2019, with Amsterdam (-14%), Rotterdam and Hamburg (both -7%) registering the most significant drops.
The total gross weight of goods handled in EU ports was estimated at 3.3 billion tonnes in 2020, substantially decreasing compared to 2019 (-7.3 %). This substantial fall can most probably be attributed to the COVID-19 pandemic and the subsequent restrictions put in place in the EU and worldwide. According to the latest figures, EU port freight activity seems to have resumed on a slight path towards recovery in 2014, a trend that was sustained in the first semester of 2019. However, the last two quarters of 2019 and all quarters of 2020 showed a negative evolution when comparing with the same quarters of the previous year. The second and third quarter of 2020 were particularly hit with decreases of -12.8 % and -8.0 %, respectively. After reaching a new peak in 2019, the gross weight of goods handled in EU ports in 2020 passed below the volumes handled in the years immediately preceding the economic downturn in Europe in 2009, with 58 million tonnes (-1.7 %) less than in the peak reached in 2007.
The Netherlands remained the largest maritime freight transport country in Europe in 2020, while Rotterdam, Antwerpen, Hamburg, Amsterdam, Algeciras, Marseille, Valencia and Trieste maintained their positions as the eight largest freight ports in the EU.
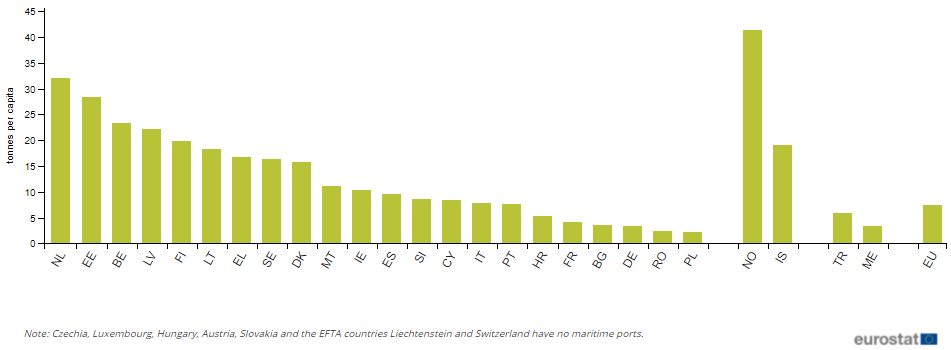
Among the EU Member States, the seaborne freight-per-capita ratio varied from 32.0 tonnes per inhabitant in the Netherlands to 2.3 tonnes per inhabitant in Poland in 2020. The EU average was 7.4 tonnes per inhabitant. However, the EFTA country Norway recorded the highest ratio of the countries reporting maritime data to Eurostat, with 41.4 tonnes per inhabitant in 2020:
Gross weight of seaborne freight handled in all ports, 2020 (tonnes per capita)
The Netherlands reported the largest volume of seaborne freight handled in Europe in 2020. At 558 million tonnes, the volume of seaborne goods handled in Dutch ports represented 16.8 % of the EU total in 2020. The Netherlands was followed by Italy and Spain, with respective shares of 14.1 % and 13.7 %.
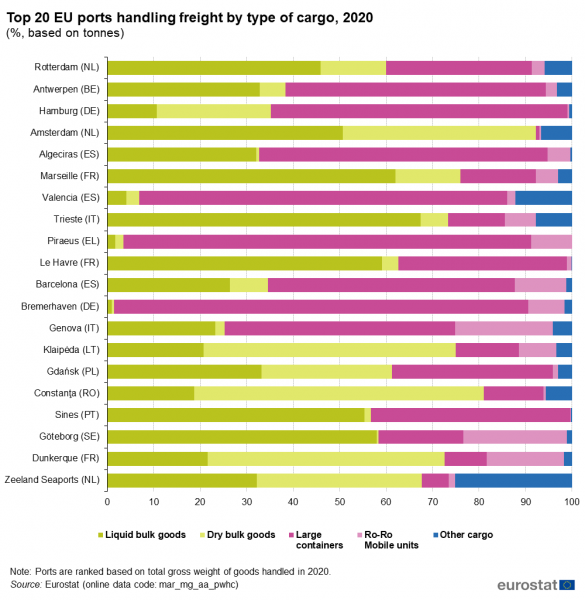
Liquid bulk goods accounted for 36.2 % of the total cargo handled in the main EU ports in 2020 (Figure 5), followed by containerised goods (25.6 %), dry bulk goods (21.2 %), and goods transported on Ro-Ro mobile units (11.3 %). The largest volumes of liquid bulk goods were handled in the Netherlands (249 million tonnes), followed by Italy (182 million tonnes) and Spain (166 million tonnes). Croatia recorded the highest share of liquid bulk goods as a percentage of the total tonnages passing through its main ports in 2020 (58.8 %), mainly reflecting large volumes of inward movements of crude oil from Turkey.

With 113 million tonnes in 2020, Dutch ports also handled the largest volumes of dry bulk goods in the EU, followed by Spain with 84 million tonnes. Even so, the tonnages of dry bulk goods handled in both the Netherlands and Spain in 2020 were lower than the 197 million tonnes reported by Turkey. Malta had the highest share of dry bulk goods as a percentage of the total tonnages in 2020 (60.2 %), mainly reflecting large volumes of inward movements of construction materials to its ports.
The eight largest cargo ports in the EU remained the same in 2020 compared to 2019. Among the top 20 EU ports, the tonnes of goods handled in 2020 increased only in two ports compared to 2019: Klaipėda (+2.3 %) and Valencia (+0.5 %). In contrast, several ports reported substantial decreases. Amongst them, the two French ports Le Havre and Dunkerque reported the highest drops, with -18.5 % and -17.6 %, respectively. The two Dutch ports Amsterdam and ‘Zeeland seaports’, as well as Genova, Gdansk and Barcelona recorded falls of more than 10 % over the same period.
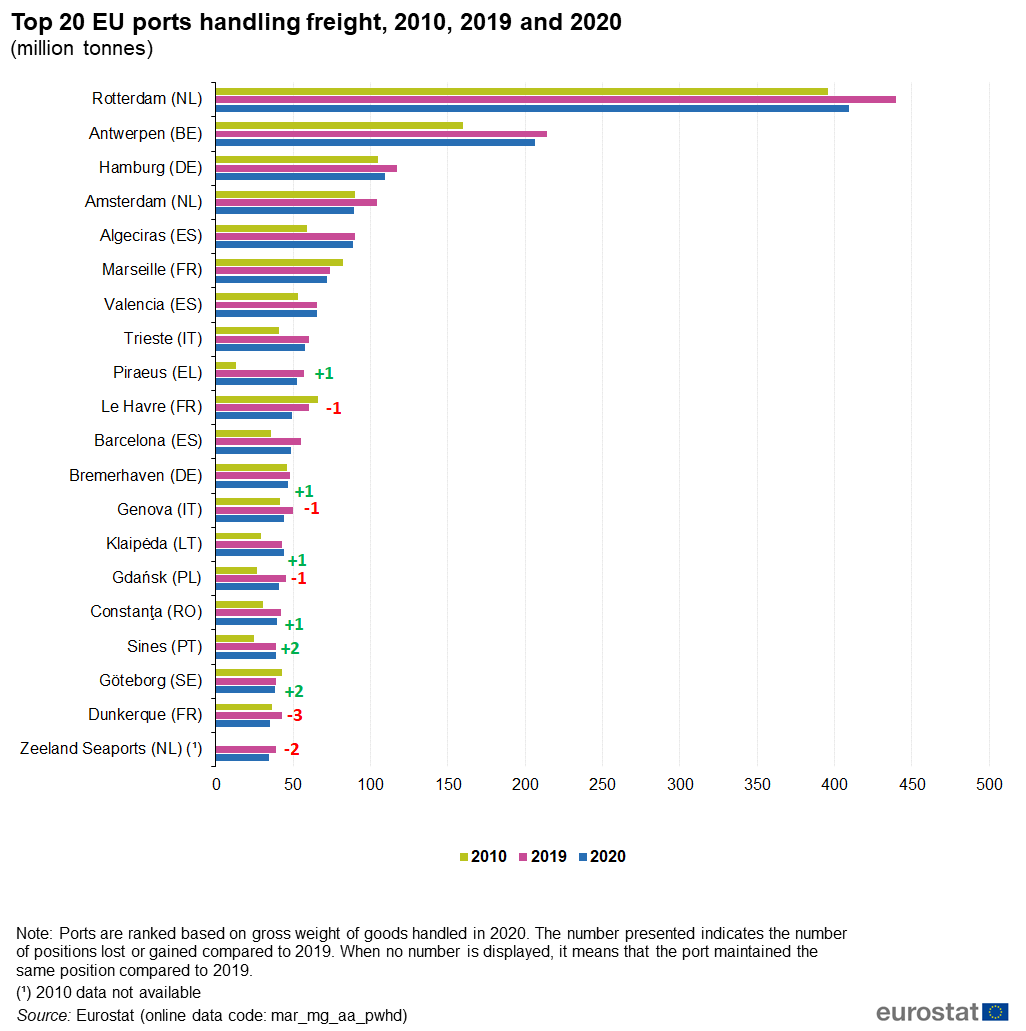
It has to be noted that the top 20 European ports in 2020 are the same as in 2019, even though the ranking is different for some ports. Dunkerque was the port falling the most in the ranking, from 16th position in 2019 to the 19th in 2020.
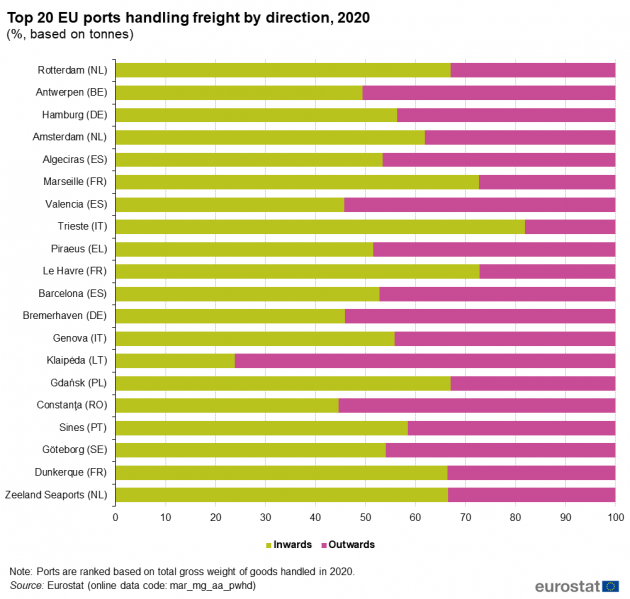
While inward activity was prevalent in 15 of the top 20 ports, the port of Klaipėda handled substantial outward movements (76 % of the total tonnage handled in the port in 2020). In addition, Antwerpen, Bremerhaven, Valencia and Constanta recorded slightly more outward than inward movements of goods.
The most specialised of the top 20 cargo ports in handling containers were Bremerhaven (89 % of the total tonnage handled in the port in 2020), Piraeus (88 %) and Valencia (79 %). The most specialised in handling liquid bulk goods was Trieste (67 %); the most specialised in handling dry bulk goods was Constanta (62 %).
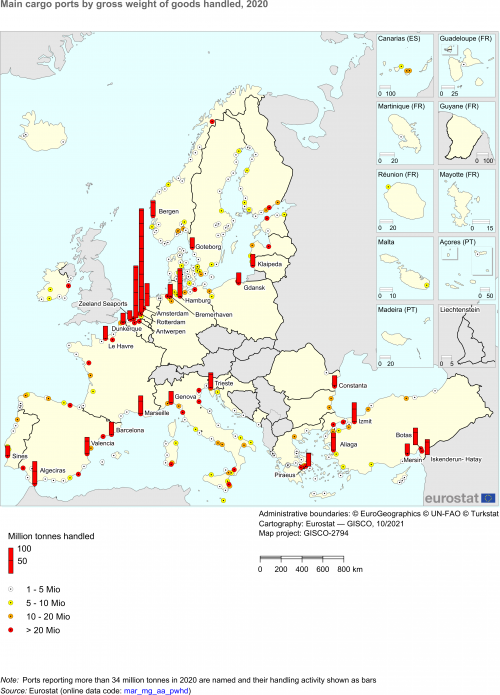
All in all, seven of the top 20 EU cargo ports in 2020 were located on the Mediterranean, seven on the North Sea coast of Europe, three ports on the Atlantic coast, two ports in the Baltic Sea and one port in the Black Sea. The composition of the national port infrastructure will sometimes determine whether a country is represented on the top 20 list of cargo ports or not. Denmark and Finland, for instance, are countries with a large number of medium-sized ports, all handling volumes of goods lower than the 34 million annual tonnes required to make the top 20 list.
In 2020, 94.3 million TEUs of containers were handled in the main EU ports
In 2020, 94.3 million twenty-foot equivalent units (TEUs) were handled in the main EU ports (Figure 11), decreasing by 2.4 % compared to 2019. When looking at empty containers, the decrease in 2020 was even more substantial (-9.3 %) while the handling of loaded containers fell only by 0.8 %.

Spain reported the largest volumes of containers handled in Europe in 2020. At 16.7 million TEUs, the volume of containers handled in Spanish ports represented 17.7 % of the EU total in 2020. Spain was followed by Germany (14.9 % of the EU total), the Netherlands (14.5 %), Belgium (13.4 %) and Italy (12.2 %). All together, these five countries had more than 70 % of the containers handled in main EU ports in 2020.

The average size of vessels calling at main EU ports is estimated at 6 900 gross tonnage per vessel
In 2020, the number of vessels calling (handling freight or embarking and disembarking passengers) in main EU ports was estimated at 1.9 million, a decrease of 14.4 % from the previous year. Italy had the highest number of port calls in 2020 (506 thousand vessels), followed by Denmark and Greece (each 324 thousand vessels), Croatia (198 thousand vessels), Spain (137 thousand vessels) and Germany (105 thousand vessels).

In 2020, the estimated gross tonnage (GT) of the vessels calling in EU ports decreased to 13.2 billion GT (-18.6 % from the previous year). These substantial falls can most probably be attributed to the COVID-19 pandemic and the subsequent restrictions put in place in the EU and worldwide. Italy recorded the largest gross tonnage of vessels calling at its main ports in 2020 with 2.4 billion GT, followed by Spain (1.8 billion GT).


Leave a Reply